Cluster Observability
Note
This section only refers to GKE Clusters using the newer "Stackdriver Kubernetes Engine Logging" and "Stackdriver Kubernetes Engine Monitoring" mechanism. If you are using Terraform, the value for the logging_service should be logging.googleapis.com/kubernetes and monitoring_service should be monitoring.googleapis.com/kubernetes.
Logging
GKE Logs
When logging.googleapis.com/kubernetes is enabled for a cluster in a project, the following resource_types now appear in Stackdriver:
- GKE Cluster Operations -
resource.type="gke_cluster"Captures actions likeCreateClusterandDeleteClustersimilar to what is shown viagcloud container operations list. Use this to know whenclustersare created/updated/deleted (including the full object specification details/settings), who performed that action, if it was authorized, and more. AddprotoPayload.authorizationInfo.granted!=trueto the filter to see all unauthorized attempts. - GKE NodePool Operations -
resource.type="gke_nodepool"Similar to GKE Cluster Operations but specific to operations onnode pools.gcloud container operations listmixes bothclusterandnode pooloperations into a single output for ease of monitoring upgrades from one gcloud command. -
Kubernetes Cluster -
resource.type="k8s_cluster"Captures actions against the Kubernetes API Server/Control Plane of allclustersin theproject. Add the filterresource.labels.cluster_name="standard-cluster-2" resource.labels.location="us-central1-a"to limit the logs to a specificclusterin a specificlocation(region or zone). Use this to know when Kubernetes resources are created/updated/deleted (including the full object specification details), who performed that action, if it was authorized, and more. Addlabels."authorization.k8s.io/decision"="forbid"or"allow"to the filter to see which actions were permitted by RBAC inside the cluster. When paired withprotoPayload.authenticationInfo.principalEmail="myemail@domain.com", this filter can help with troubleshooting RBAC failures during the development of RBACClusterRolesandRoles.You might want to configure filters and sinks/exports for all RBAC failures and look for anomalies/failures of service accounts. For instance, if
protoPayload.authenticationInfo.principalEmail="kubelet"does not have a UserAgent like:protoPayload.requestMetadata.callerSuppliedUserAgent="kubelet/v1.13.7 (linux/amd64) kubernetes/7d3d6f1", but instead one corresponding tocurlorkubectl, it's a near-guarantee that a malicious actor has stolen and is using thekubelet's credentials. -
Kubernetes Node -
resource.type="k8s_node"Captures all logs exported from the GCE Instance operating system for allnodesin allclustersin theproject. In the case ofCOS, these aresystemdlogs. Add the filterjsonPayload._SYSTEMD_UNIT="kubelet.service"to see logs from thekubeletsystemd unit, and add a filter likeresource.labels.node_name="gke-standard-cluster-1-default-pool-de92f9ef-qwpq"to limit the scope to a singlenode. - Kubernetes Pod -
resource.type="k8s_pod"Capturespod"events" logs that describe the lifecycle/operations ofpods. If you runkubectl describe pod <podname>and view the "Events" section manually during troubleshooting, these will be familiar. It's important to note that the "Events" logs in Kubernetes do not persist after a certain period of time, so shipping these to Stackdriver allows for diagnosing issues after the fact. Adding the filterresource.labels.pod_name="mynginx-5b97b974b6-6x589" resource.labels.cluster_name="standard-cluster-2" resource.labels.location="us-central1-a" resource.labels.namespace_name="default"allows for narrowing things down to a specificpodin a specificnamespacein a specificcluster. - Kubernetes Container -
resource.type="k8s_container"Captures the per-containerlogs that your application emits. The same output as if you runkubectl logs mypod -c mycontainer. In addition to thecluster/namespace/podfilters also used by thepodlogs, addresource.labels.container_name="mycontainer"to get the logs from a specificcontainer.
In-Cluster Logging Deployments
NAMESPACE     NAME                                                        READY   STATUS    RESTARTS   AGE
kube-system   event-exporter-v0.2.5-7df89f4b8f-cd9z9                      2/2     Running   0          23m
kube-system   fluentd-gcp-scaler-54ccb89d5-s6wqf                          1/1     Running   0          23m
kube-system   fluentd-gcp-v3.1.1-4zqtb                                    2/2     Running   0          23m
kube-system   fluentd-gcp-v3.1.1-7rcnc                                    2/2     Running   0          23m
kube-system   stackdriver-metadata-agent-cluster-level-5789cffbb4-lfg8l   1/1     Running   0          23m
- Event Exporter - A simple API Server
event"watcher" with a "prometheus-to-stackdriver" sidecar for shipping cluster events to Stackdriver logs. - Fluentd GCP - The main logging agent that ships all pod/container logs to Stackdriver. Runs as a
daemonsetwith a single replica per worker node, and has a "prometheus-to-stackdriver" sidecar for shipping fluentd's logging metrics about log counts, etc. Note: Runs asroot, binds to thehostNetwork, and mounts several logging relatedhostPathmounts. These are necessary to do its job, but be aware of who has the ability to runkubectl execintopodsin thekube-systemnamespace. - Stackdriver Metadata Agent - A simple API Server resource "watcher" that sends metadata about
nodes,pods,cronjobs,daemonsets,deployments,endpoints,ingresses,jobs,namespaces,replicasets,replicationcontrollers,services, andstatefulsetsto Stackdriver so that the dashboard has the appropriate context.
COS Auditd Logs
By default, logs from the Linux audit subsystem are not shipped via the native Stackdriver Kubernetes Engine Logging mechanism on GKE Worker instances running COS. To capture and ship these logs, you must manually deploy a separate daemonset from this YAML manifest. This daemonset pulls specific logs from the operating system above and beyond the normal Stackdriver Kubernetes Engine Logging daemonset. Examples include:
auditdconfiguration modifications- AppArmor logs
- Executions of
execve(),socket(),setsockopt(), andmmap() - User logins
- SSH session and TTY sessions
These are potentially verbose but very important logs from a security perspective. It is recommended that you deploy this immediately after creating the cluster.
Below is a snippet from a TTY (SSH session) to a GKE node with a couple MESSAGE field contents:
resource.type="gce_instance"
jsonPayload.SYSLOG_IDENTIFIER="audit"
SYSCALL arch=c000003e syscall=59 success=yes exit=0 a0=1051108 a1=10552c8 a2=1052008 a3=59a items=2 ppid=72125 pid=72142 auid=4294967295 uid=0 gid=0 euid=0 suid=0 fsuid=0 egid=0 sgid=0 fsgid=0 tty=pts0 ses=4294967295 comm="hostname" exe="/bin/hostname" key=(null)
USER_START pid=85481 uid=0 auid=5002 ses=6 msg='op=PAM:session_open grantors=pam_loginuid,pam_env,pam_lastlog,pam_limits,pam_env,pam_unix,pam_permit,pam_tty_audit,pam_mail acct="myusername" exe="/usr/sbin/sshd" hostname=74.125.177.96 addr=74.125.177.96 terminal=ssh res=success'
In order to get logs from other systemd units like sshd.service, you can modify the ConfigMap of the YAML manifest and add this block following below the linux-auditd block:
    <source>
      @type systemd
      filters [{ "_SYSTEMD_UNIT": "sshd.service" }]
      pos_file /var/log/gcp-journald-sshd.pos
      read_from_head true
      tag sshd
    </source>
To take effect, run kubectl delete -f cos-auditd-logging.yaml and kubectl apply -f cos-auditd-logging.yaml.
SSHD related logs will appear using the following filter:
resource.type="gce_instance"
jsonPayload._SYSTEMD_UNIT="sshd.service"
pam_unix(sshd:session): session opened for user myusername by (uid=0)
GCE Logs for GKE Clusters
- GCE Instance Group -
resource.type="gce_instance_group"Logs when GKE worker instances are added/removed from thenode poolinstance group. - GCE Instance Group Manager -
resource.type=""Logs for GCE Instance group operations success/failure. - GCE Instance Template -
resource.type=""Logs for when theinstanceTemplatefor anode poolinstance group is inserted/updated/deleted. - GCE VM Instance -
resource.type="gce_instance"Logs when GKE worker instances are inserted/deleted, their secure boot attestation output status, and more. - GCE Disk -
resource.type="gce_disk"Shows GKE specific operations on the underlying GCE VM Disks. - GCE Subnetwork -
resource.type="gce_subnetwork"Shows GKE specific operations on thesubnetswhenclustersandnode poolsare modified.
Log Exports
The CIS GCP Benchmarks include a requirement to have a "full" export of all Stackdriver logs to a more permanent destination. Admin activity logs are stored for you for just over a year, but data access logs are only available for 30 days. Exporting all logs to a GCS Bucket with a retention policy and lifecycle policy that moves them to "colder" storage over time is highly recommended and often required by compliance frameworks. See Log Exports for the mechanics for setting up exports to GCS, Pub/Sub, and/or BigQuery. Keep in mind that exports only apply to new log lines that arrive after the export is in place.
Resources
Monitoring
When monitoring.googleapis.com/kubernetes is enabled for a cluster in a project, the following now appears in Stackdriver:
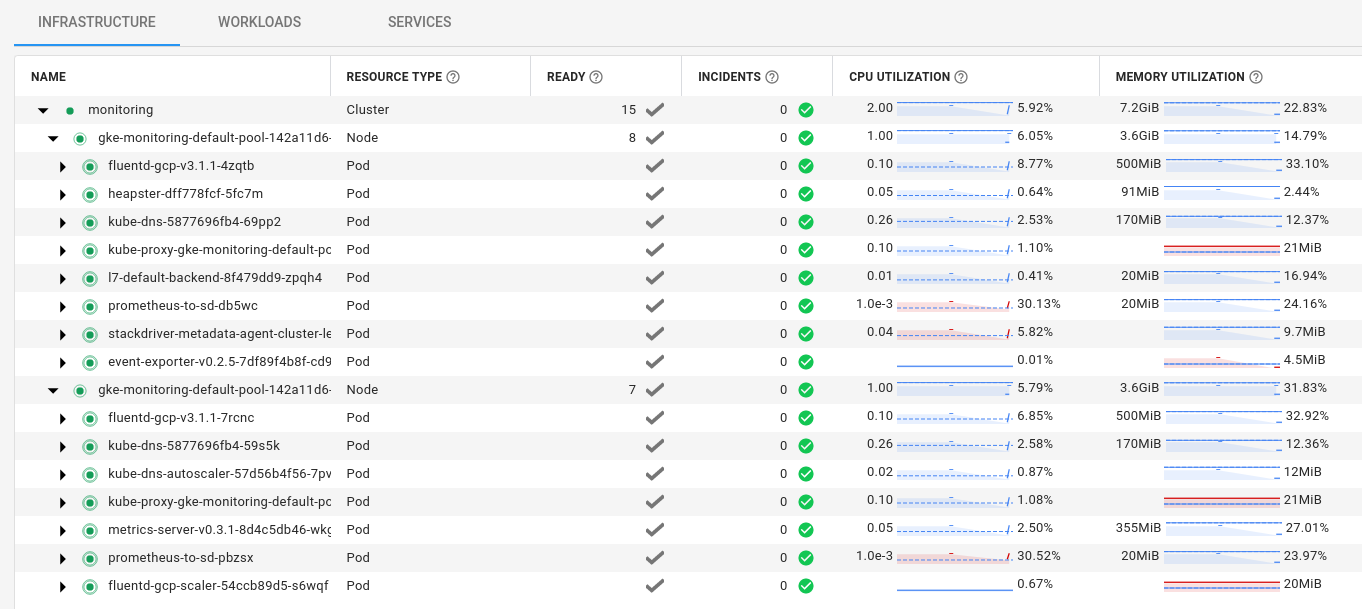
The combination of the following In-Cluster Monitoring Deployments ships all metrics-related items to Stackdriver:
kube-system   heapster-dff778fcf-5fc7m                                    3/3     Running   0          58m
kube-system   metrics-server-v0.3.1-8d4c5db46-wkgwn                       2/2     Running   0          57m
kube-system   prometheus-to-sd-db5wc                                      1/1     Running   0          57m
kube-system   prometheus-to-sd-pbzsx                                      1/1     Running   0          57m
kube-system   stackdriver-metadata-agent-cluster-level-5789cffbb4-lfg8l   1/1     Running   0          23m
-
Heapster - A deployment that ships certain metrics directly to Stackdriver through a "prometheus-to-stackdriver" sidecar. To see which metrics are exported, run:
kubectl exec -it -n kube-system $(kubectl get pod -n kube-system -l k8s-app=heapster --no-headers -o custom-columns=":metadata.name") -c heapster-nanny -- wget -qO - localhost:8082/metrics
-
Metrics Server - An API Server extension (
metrics.k8s.io/v1beta1) that provides the current resources used bynodesorpodsfor commands such askubectl top nodesandkubectl top pods. Used as the main resource usage point for controllers like thehorizontal-(HPA) andvertical-pod-autoscaler(VPA).$ kubectl top nodes NAME CPU(cores) CPU% MEMORY(bytes) MEMORY% gke-monitoring-default-pool-142a11d6-142p 54m 5% 708Mi 26% gke-monitoring-default-pool-142a11d6-zf1k 46m 4% 676Mi 25%
$ kubectl top pods -A
NAMESPACE     NAME                                                        CPU(cores)   MEMORY(bytes)
kube-system   event-exporter-v0.2.5-7df89f4b8f-cd9z9                      1m           17Mi
kube-system   fluentd-gcp-scaler-54ccb89d5-s6wqf                          21m          34Mi
kube-system   fluentd-gcp-v3.1.1-4zqtb                                    9m           138Mi
kube-system   fluentd-gcp-v3.1.1-7rcnc                                    7m           137Mi
kube-system   heapster-dff778fcf-5fc7m                                    2m           35Mi
kube-system   kube-dns-5877696fb4-59s5k                                   2m           28Mi
kube-system   kube-dns-5877696fb4-69pp2                                   2m           28Mi
kube-system   kube-dns-autoscaler-57d56b4f56-7pv8j                        1m           6Mi
kube-system   kube-proxy-gke-monitoring-default-pool-142a11d6-142p        1m           11Mi
kube-system   kube-proxy-gke-monitoring-default-pool-142a11d6-zf1k        3m           12Mi
kube-system   l7-default-backend-8f479dd9-zpqh4                           1m           2Mi
kube-system   metrics-server-v0.3.1-8d4c5db46-wkgwn                       1m           17Mi
kube-system   prometheus-to-sd-db5wc                                      0m           9Mi
kube-system   prometheus-to-sd-pbzsx                                      1m           9Mi
kube-system   stackdriver-metadata-agent-cluster-level-5789cffbb4-lfg8l   3m           17Mi
-
Prometheus to Stackdriver - A "prometheus-to-stackdriver"
daemonsetthat ships the localkube-proxy(localhost:10249) andkubelet(localhost:10255) prometheus-formatted metrics to stackdriver. Runs on thehostNetwork. To see what they each export, run:kubectl run --rm -it busybox --image=busybox --restart=Never --overrides='{"kind":"Pod", "apiVersion":"v1", "spec": {"hostNetwork":true}}' -- wget -qO - localhost:10249/metricskubectl run --rm -it busybox --image=busybox --restart=Never --overrides='{"kind":"Pod", "apiVersion":"v1", "spec": {"hostNetwork":true}}' -- wget -qO - localhost:10255/metrics -
Stackdriver Metadata Agent - A simple API Server resource "watcher" that sends metadata about
nodes,pods,cronjobs,daemonsets,deployments,endpoints,ingresses,jobs,namespaces,replicasets,replicationcontrollers,services, andstatefulsetsto Stackdriver so that the dashboard has the appropriate context.
Other Considerations
- If you want to use a third party monitoring system such as prometheus or DataDog, you can still install and manage them yourself inside your cluster alongside these components.
- You most likely cannot customize the Stackdriver monitoring/logging
deploymentsorconfigmapsdirectly as the add-on manager will reconcile them to their original state. To be able to customize the components, you must opt-out of installing these components during cluster creation and manually install them from manifests. This isn't a common or recommended practice as you will be responsible for maintaining compatibility across GKE version upgrades yourself, but it's available for advanced use cases. - Note that metrics and logs go to the local Stackdriver
project, so multi-tenantclusteruse cases will co-mingle that data for all tenants by default. Giving IAM permissions to view logs and metrics isproject-scoped, so giving a tenant the ability to see the data gives them access to cluster-wide metrics and logs.